Glyphosate use in Bollinger County, Missouri
Estimated farm glyphosate use in Bollinger County, Missouri was 61 pounds per square mile of county land in 2019, higher than 53% of US counties.
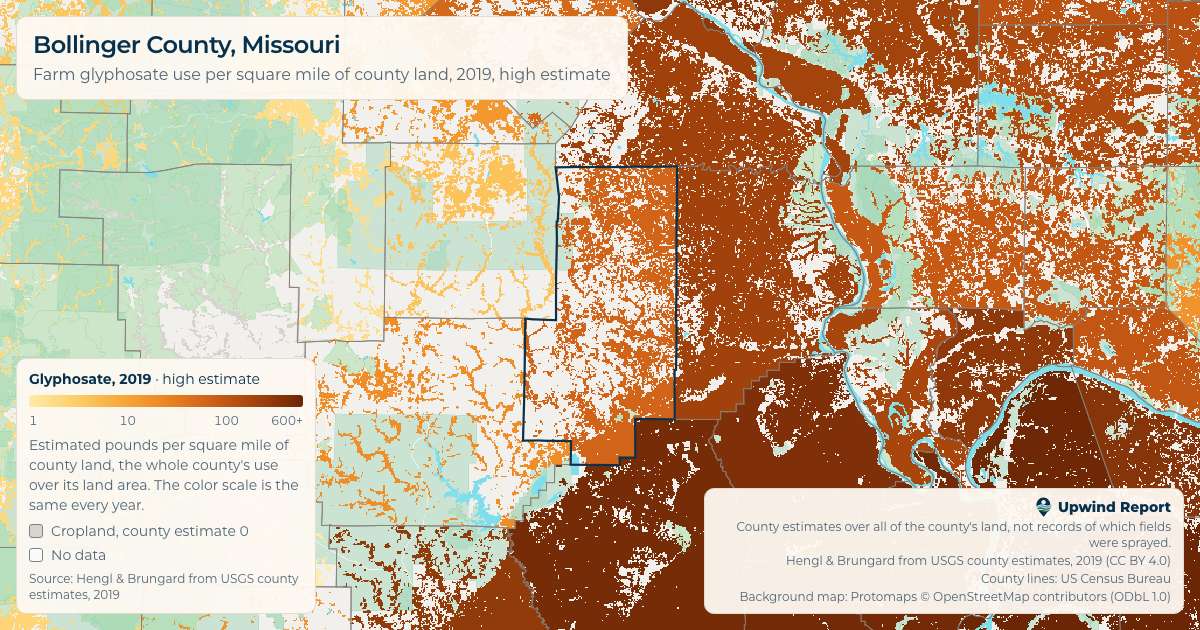
2019 numbers
- US
- 1,431st of 3,060
- Missouri
- 69th of 114
Ranks are by use per square mile of county land, on the 2019 high estimate, among US counties with a value. Counties with the same value share a rank.
Share image
A picture of Bollinger County against the US county median, with the source, to post or send.
Since 2000
Up from 21 in 2000 to 61 in 2019. Pounds per square mile of county land, high estimate.
Every year's numbers
| Year | Low | High |
|---|---|---|
| 2000 | 18 | 21 |
| 2001 | 6.0 | 30 |
| 2002 | 27 | 27 |
| 2003 | 3.0 | 36 |
| 2004 | 41 | 41 |
| 2005 | 12 | 12 |
| 2006 | 53 | 53 |
| 2007 | 62 | 65 |
| 2008 | 30 | 30 |
| 2009 | 51 | 51 |
| 2010 | 83 | 83 |
| 2011 | 88 | 88 |
| 2012 | 53 | 53 |
| 2013 | 23 | 23 |
| 2014 | 85 | 85 |
| 2015 | 12 | 12 |
| 2016 | 152 | 155 |
| 2017 | 47 | 47 |
| 2018 | 32 | 32 |
| 2019 | 61 | 61 |
About these numbers
The main number is the county's estimated farm glyphosate use for the year divided by all of its land, water left out. A county with a little farmland can use a lot per square mile of cropland and still have far less in total than a county with more farmland, so the whole-county number is the one the map colors, ranks and compares.
These are county estimates, not records. They don't show which fields were sprayed or how much any one field got.
USGS makes a low and a high estimate, which fill in use that farms didn't report in different ways.
Per square mile of cropland is the same total spread evenly over the county's cropland only, so it's higher than the whole-county number wherever only part of Bollinger County, Missouri is farmland.
Numbers are in pounds per square mile. The source gives kilograms per square kilometer, and 1 kg per km² is about 5.7 pounds per square mile.
Source: Hengl & Brungard from USGS county estimates, 2000–2019 (CC BY 4.0). Land area: US Census Bureau, 2020.
This page shows estimated farm use only. It says nothing about health and is not medical advice.